Sunday 28 September 2014

Customizing PieCharts in Jasper Reports 


Pie charts are a form of an area chart that are easy to understand with a quick look. They show the part of the total (percentage) in an easy-to-understand way. Pie charts are useful tools that help you figure out and understand polls, statistics, complex data, and income or spending. They are so wonderful because everybody can see what is going on. Use them to make excellent visual displays that explain data to other people-- in school projects, work presentations or pitching sales figures to clients. 

Here in this tutorial I will show how to customize PieCharts:

1. ) First drag charts into the report from palette window.

2. ) In the charts window select 2d pie chart.

3. ) Default view of pie chart


   4. ) Remove legend and labels by unchecking Show Legend and Show Label from PieChart properties tab .


5. ) Now the pie chart would look like this.


 6.) Now I will show you how to further customize pie chart , we will create a java project( I have creatred a java project named CustomizedCharts ).

 7.) Add com.mysql jar file , jasperreports jar file , jcommon jar file , jfreecharts jar file.


  8.) Here is the customize code to denote one pie with value January separately.

   9.) Build the project and add classpath to Ireport by clicking Tools->Options->ClassPath->Add Jar


   10.) Now Add customizer bar chart by selecting customizer class option.
   

   11.) After putting customized code the chart would look like this.

  12.)  To create full exploded chart view. Here is the code to create full exploded view of piechart


   13.) After applying this code it chart would look like


    Hope this article would be helpful.
    Please put your views or questions or suggestions below, I will be more than happy to hear them..

Monday 15 September 2014

Customize JfreeBarChart

A bar chart or bar graph is a chart with rectangular bars with lengths proportional to the values that they represent.We need charts to represent data in pictorial format so that it becomes more appealing.

We have chart options present palette but they have very limited customization properties available therefore we need customizer classes to represent graph in a better format.

In this article I will show how to customize chart both by using customization properties in ireport
and through customizer classes.

Now how to create charts:

1.) Drag chart from palette window into detail band or summary band depending upon requirements.
(I have used chart in summary band).

2.) From the Palette choose bar chart option.

3.)Choose Bar chart Series color (I have chosen grey as series color)


4.)Default view of Bar Chart.
Default View BarChart

5.)Remove legend by unchecking ShowLegend,Tick-marks and Tick-labels shown in red tick mark.
Customize Bar Chart


6.)View Of BarChart.
Customized Bar Chart


7.) Now I fill Show how to further customize bar chart remove X-axis and Y-axis grid lines.
In order to further customize bar chart we will create a java project(I have created Project named CustomizedCharts).

8.)Add com.mysql jar file , jasperreports jar file , jcommon jar file , jfreecharts jar file.
Jar files required

9.)This is the customized chart code to remove X and Y horizontal and vertical gridlines.
Customizer Classes

10.)Build the project and add classpath to Ireport by clicking Tools->Options->ClassPath->Add Jar.

11.)Now Add customizer bar chart by selecting customizer class option.


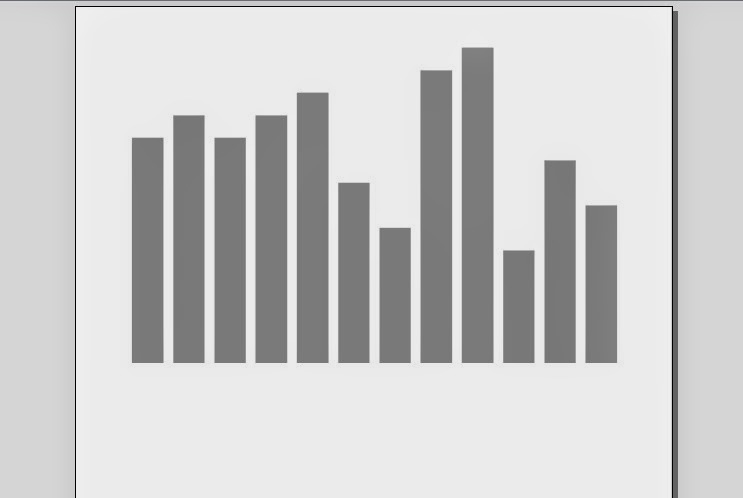
12.)After implementing cutomization class the bar chart looks like.


13.) Now we will make customized bar renderer class to show maximum length bar with green color and minimum bar chart with blue color.We will add following code in BarChart Class shown
in 9th point.

//Set the Customized Bar Renderer
CustomizedCharts renderer = new CustomizedCharts();
chart.getCategoryPlot().setRenderer((CategoryItemRenderer) renderer);

14.)Following is CustomizedCharts Class code that implements BarRenderer
15.)View of cutomized chart showing maximum with green and minimum with red color.

Hope this article would be helpful.

Please put your views or questions or suggestions below, I will be more than happy to hear them..